

To continue our investment topics, we will be discussing the main two strategies relating to investment analysis.
Fundamental analysis and Technical analysis refer to the strategies used by fund managers, institutional investors, day-traders, and many portfolio managers to determine when and what to buy or sell.
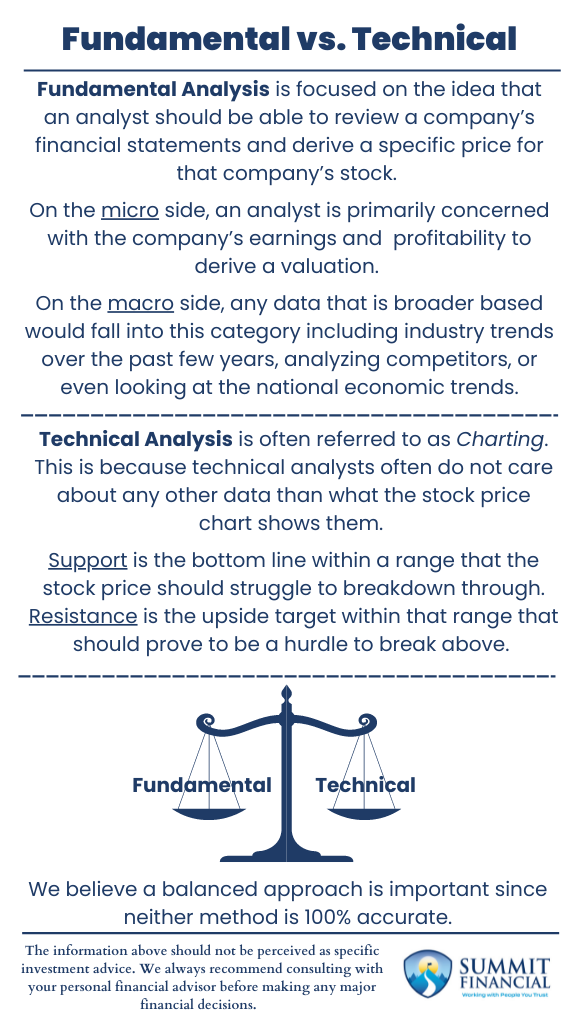
While the argument as to which is better will be a lifelong debate, we choose to utilize a blend of both strategies here at Summit. No one is ever 100% right, so we believe it is prudent to analyze all types of research. Without further delay, let us begin.
Fundamental Analysis
Fundamental analysis is focused on the idea that an analyst should be able to review a company’s financial statements and derive a specific price for that company’s stock. This stock price is referred to as the intrinsic value and it represents the analyst’s price target. If the stock is below this price, then that suggests investors should be buying. If the stock price is above the intrinsic value, then they would expect investors to be sellers.
So, what type of factors influence the intrinsic value? If it uses company specific or economic data, then it is most likely a fundamental factor. Reviewing a company’s specific financials is referred to as micro-analysis and examining the broader industry or economy is referred to as macro-analysis.
Micro-Analysis: Understanding Company Financials
On the micro side, an analyst is primarily concerned with the company’s profitability to derive a valuation. (If you have ever seen Shark Tank, using profits and revenues to rationalize a valuation is form of fundamental analysis.) Two of the most widely discussed valuation techniques are Earnings Per Share (EPS) and the Price-to-Earnings (PE) ratio.
Earnings Per Share focuses on how much money the company is making in relation to the number of shares of stock they have issued. Higher earnings or lesser shares means the company stock should be priced higher. If you are comparing two companies with the same number of shares outstanding, how do you know which company should be priced higher? The answer is the one with the higher revenues.
Likewise, the Price-to-Earnings ratio is very similar as it compares a company’s profitability to the current stock price. If a company fails to increase revenue but their stock continues to climb, this will result in a high PE ratio and may cause the stock to become overvalued or due for a decline.
Macro-Analysis: Broader Economic Factors
On the macro side, any data that is broader-based would fall into this category. This would include looking at the industry trends over the past few years, analyzing competitors, or even looking at the national economy.
If company X is being analyzed, but competitors Y and Z have seen declining profits, it may be possible for company X to be faced with the same headwinds. If company X is in the U.S. and we enter a recession, company X may struggle moving forward. Macro-analysis is all about using broader research to determine how a specific company may perform.
Technical Analysis
Technical Analysis is often referred to as Charting. This is because technical analysts often do not care about any other data than what the stock price chart shows them. They use the company’s stock chart to identify trends and predict which direction the stock price should move.
Support and Resistance: Key Technical Indicators
One of the main strategies within technical analysis is identifying the support and resistance levels. Support is the bottom line within a range that the stock price should struggle to breakdown through. Resistance is the upside target within that range that should prove to be a hurdle to break above. If either of these lines break, then a technical analyst should expect further movement in that direction.
Support can be identified by a stock hitting its head multiple times at the same price. Or it may be derived by rationalizing the average price increase in an upwards trend and applying that amount to where the trend started. Resistance levels can be derived using the same ideology except looking at the downside potential rather than upside.
Volume and Momentum: Gauging Market Strength
Technical analysts are also concerned with volume and momentum of the company stock. A 1% up day on low volume does not provide nearly as much strength as a 1% up day on high volume. With more trades being placed, this provides additional confirmation and strength that their identified trend is correct.
Momentum can be thought of as the volume over a given period. With a high quantity of buy orders, the momentum will be stronger and should continue to trend in that same direction. However, it is possible for a stock to become too hot and become overbought. This exaggeration in momentum means that a cool-off period may be expected. Of course, volume and momentum work the same way to the downside as well.
Here is a basic example illustrating the support and resistance lines. As you can see from 01/01/2000 to 12/31/2009, the S&P 500 (SPY) spent a majority of time within a rising channel (purple lines). When the market broke above resistance, it fell back within the range pretty quickly. When support was lost in 2007/2008, the market fell hard.

Chart received from https://ycharts.com/ with added technical analysis channel.
Speak With a Trusted Advisor
If you have any questions about budgeting, your investment portfolio, taxes, retirement planning, our 401(k)-recommendation service, or anything else in general, please call our office at (586) 226-2100. Please also reach out if you have had any changes to your income, job, family, health insurance, risk tolerance, or overall financial situation.
Feel free to forward this commentary to a friend, family member, or co-worker. We hope you learned something today. If you have any feedback or suggestions, we would love to hear them.
Zachary A. Bachner, CFP®
with contributions from Robert Wink, Kenneth Wink, and James Wink
