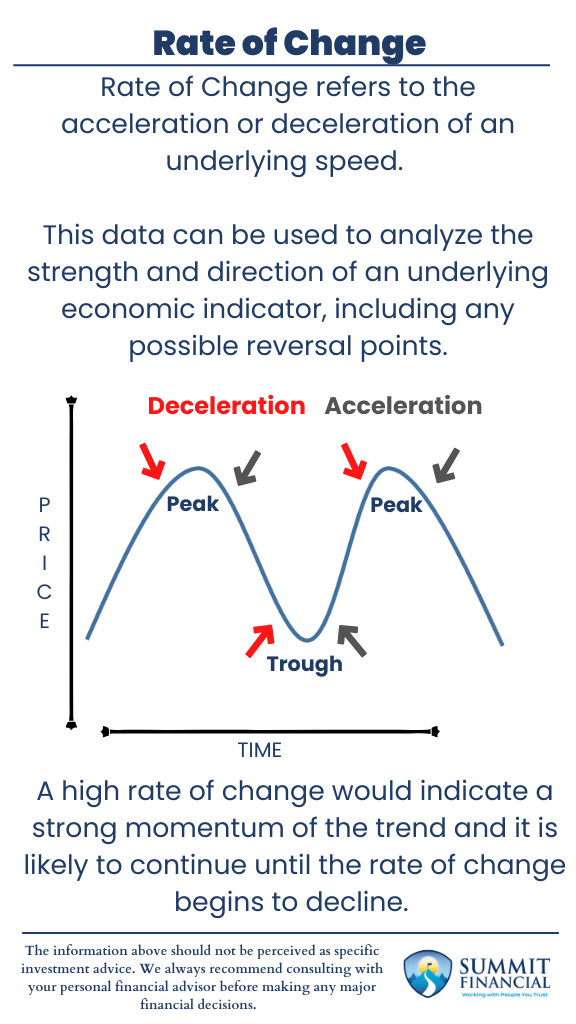
Rate of Change is an important concept for financial analysts and economists. The average investor does not use the concept as often, but we believe understanding the tool is still important. Rate of Change refers to the acceleration or deceleration of an underlying speed.
For example, a car that is driving forward at 50mph and continues to drive 50mph will have a rate of change of 0. The vehicle is still progressing down the road, but it is traveling at a consistent speed.
If this car speeds up to 60mph, then the rate of change would be 20% as it is now progressing down the road at a faster rate. (10mph/50mph = 20%) If this car decides to slow down to 25mph, then the rate of change would be -50%. (-25mph/50mph = -50%) This car is now traveling down the road at half the original speed, so there was a negative 50% rate of change.

How Rate of Change Applies to Economic Indicators
This concept can be applied to various economic indicators and also a stock’s or asset’s price movement. Most recently, we believe everyone has been aware of the recent rise in inflation. Historically, Inflation is around 3% per year, but we are all aware that we have been dealing with higher than average levels.
If inflation were steady at the 3% level, then there would be a 0% rate of change in the metric. However, inflation peaked in June of 2022 just above 9%, so there was a 300% total rate of change.
A closer look at the monthly breakdown will reveal that the trend started to speed up in the spring of 2021. We saw increases of 1.00%, 1.50%, and 0.80% for the months of March-May of 2021.
Inflation continued to increase afterward, but it was more consistent and at a slower rate of change. March-May of 2022 actually saw a slight dip, then a reversal back to the previous level of inflation, and this period was followed by the inflation peak in June of 2022.
Rate of Change and Market Trends
The slowdown in the rate of change could have been indicative that we were approaching a reversal point for inflation. Of course, it is impossible to predict exactly what the future holds, but this slowdown did present a possible top for inflation.
We very well could have continued to see an increase in inflation after June of 2022, but the slower rate of change means that we were getting closer and closer to the top. A more substantial rate of change means the trend has stronger momentum and is not likely to stop on a dime and reverse. Usually, the underlying indicator or price would need to slow down before the overall direction will change.
It is important to note acceleration/deceleration refers to the speed of the current trend and not the overall direction. It is very possible to accelerate to the downside and decelerate to the upside.
Using Rate of Change to Analyze Investments
This analytical process can be used to predict economic indicators such as inflation, GDP, unemployment, etc., and identifying the strength and direction of these indicators may allow investors to identify future possibilities.
For example, identifying a high rate of change in US GDP may allow an investor to feel confident in their growth investments. On the other hand, a decline in the rate of change may provide an investor with the clues necessary to shift more defensive in preparation of a potential economic slowdown. Stock and Asset Prices can also be evaluated using the rate of change as analysts try to predict the future trend.
Of course, this method is not 100% guaranteed, and there certainly could be other variables that will affect estimates, but it is a handy tool for every investor to be aware of. Investing can be a very mathematical process and this little bit of calculus may prove to be beneficial at identifying important trends reversals.
Passive Income Highlights
- Passive income allows investors to generate an additional income stream without having to put in physical work on their end.
- Some of the most common sources include rental real estate, stock dividends, small business investing, etc.
- While passive income is a great way to achieve financial goals, it may not be suitable or the best option for every situation.
Speak With a Trusted Advisor
If you have any questions about your investment portfolio, retirement planning, tax strategies, our 401(k) recommendation service, or other general questions, please give our office a call at (586) 226-2100.
Please feel free to forward this commentary to a friend, family member, or co-worker. If you have had any changes to your income, job, family, health insurance, risk tolerance, or your overall financial situation, please give us a call so we can discuss it.
We hope you learned something today. If you have any feedback or suggestions, we would love to hear them.
Best Regards,
Zachary A. Bachner, CFP®
with contributions from Robert Wink, Kenneth Wink, James Wink, James Baldwin
If you found this article helpful, consider reading:
- Navigating College Funding
- Financial Planning Mistakes to Avoid
- Debt Repayment Strategies
- How to Negotiate a Raise
Sources:
-
- https://www.investopedia.com/terms/r/rateofchange.asp#:~:text=Rate%20of%20change%20(ROC)%20refers,and%20identify%20momentum%20in%20trends.
- https://www.khanacademy.org/math/algebra/x2f8bb11595b61c86:functions/x2f8bb11595b61c86:average-rate-of-change/v/introduction-to-average-rate-of-change
- https://www.investopedia.com/terms/m/momentum.asp
- https://ycharts.com/indicators/us_inflation_rate#:~:text=US%20Inflation%20Rate%20is%20at,long%20term%20average%20of%203.27%25


