

We previously discussed the difference between Fundamental and Technical analysis in our blog post on Fundamental Analysis. This blog will focus on a specific subset of analysis – overbought vs oversold.
In general, the idea is that the market may go through cyclical peaks and troughs, and the optimal goal is to buy at the bottom and sell at the top (Schwab). These are the ideal entry and exit points for market traders who try to time price trends. Below, we will provide an example of a Fundamental indicator and a Technical indicator that can be used to discover when the market may potentially be overbought or oversold.
All content is for information purposes only. It is not intended to provide any financial decisions. Nor is it intended to be a projection of current or future performance or indication or future results.
Investor Suitability and Risk
While the analysis styles below may be helpful, it is important to remember that every investor has a personal risk tolerance and trading individual stocks or specific funds may not be suitable for everyone. We also want to stress that one indicator on its own may not always be successful and that a combination of indicators may provide more confidence in a particular trade setup, but still cannot be a guarantee of future performance.
Fundamental Indicator: P/E ratio compares price to earnings
First, the Price-to-Earnings (P/E) ratio is a fundamental data point that assesses a company’s current stock price to the amount of money the company makes. A higher P/E ratio means the stock price is higher or the company is earning less. A lower P/E ratio means either a lower stock price or high earnings from the company.
The “average” or “normal” P/E ratio changes from company to company and from sector to sector, so these are best used to analyze against a company’s peers (Schwab).
Example: Market Interpretation
For example, let’s say a market sector and a public company are both assumed to have an average P/E ratio of 30. Now if the ratio were to double to 60, some traders may view this as being overbought and that the company may be seen as likely for a pullback in the stock price to revert back to the expected ratio of 30.
On the other hand, if the P/E ratio were to drop by half down to 15, some traders might view that as oversold and expect the stock to rebound in order to get closer to the expected value of 30.
Technical Indicator: Relative Strength Index
Next, on the technical analysis side, we’ll explain the Relative Strength Index, or RSI. This indicator is a gauge of a stock’s recent momentum or trend with a potential range from 0 to 100.
The standard duration for the indicator is normally a 14-day calculation, which means the previous 14 trading periods are inputted and weighted to calculate the momentum of the underlying stock. The higher the index value, the more overbought a stock may be. And the lower the value, the more oversold it may be.
Stocks that move higher will trend towards a higher RSI, and stocks that are falling should also see a drop in their RSI. Also, the speed at which a stock moves up and down would influence the underlying RSI as well (Investopedia).
RSI Thresholds
We view an overbought RSI as anything with a score of approximately 70 or above and potentially could see the stock drop to get back below that threshold. We also believe an oversold indicator would be a stock with an RSI score of approximately 30 or below, which could lead to a rebound in the stock’s price to get back above that limit.
A score of 50 would be right in the middle of the range and would not provide guidance as to where the next move may take the stock.
Combining Methods: Investor integrates fundamental and technical analysis
Understanding when a stock may be overbought or oversold can be a valuable tool for making more informed investment decisions. While no single indicator provides perfect guidance, combining elements of both fundamental and technical analysis may improve decision-making over time.
As always, our team is here to help you interpret these signals and ensure your investment strategy remains aligned with your long-term goals.
Key Takeaways: Overbought vs. Oversold Indicators
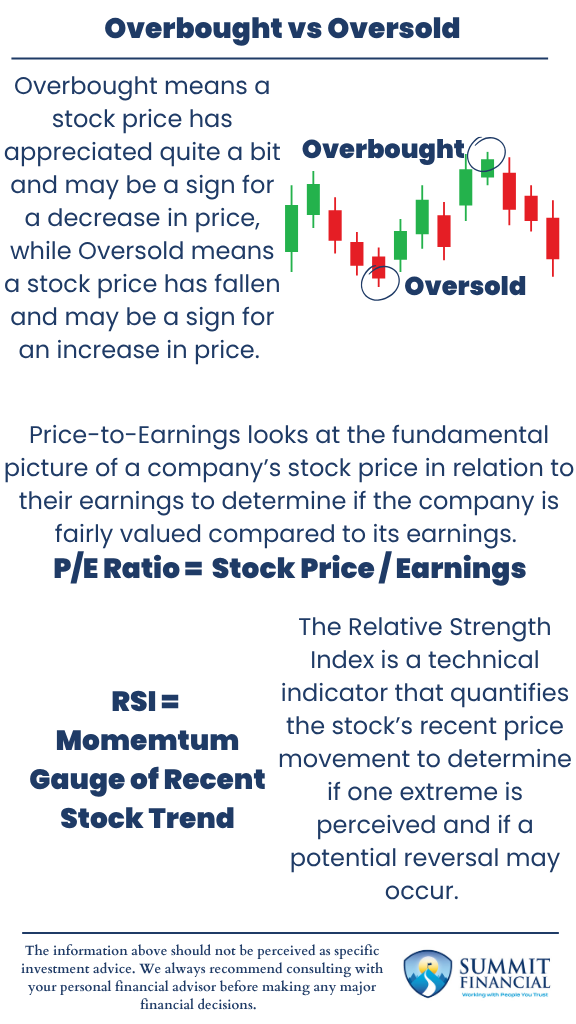
- Overbought means a stock price has appreciated quite a bit and may be a sign for a decrease in price, while Oversold means a stock price has fallen and may be a sign for an increase in price.
- Price-to-Earnings looks at the fundamental picture of a company’s stock price in relation to their earnings to determine if the company is fairly valued compared to its earnings.
- The Relative Strength Index is a technical indicator that quantifies the stock’s recent price movement to determine if one extreme is perceived and if a potential reversal may occur.
Speak With a Financial Advisor
If you have any questions about your investment portfolio, retirement planning, tax strategies, our 401(k) recommendation service, or other general questions, please give our office a call at (586) 226-2100. Please feel free to forward this commentary to a friend, family member, or co-worker. If you have had any changes to your income, job, family, health insurance, risk tolerance, or your overall financial situation, please give us a call so we can discuss it.
We hope you learned something today. If you have any feedback or suggestions, we would love to hear them.
Sincerely,
Zachary A. Bachner, CFP®
with contributions from Robert Wink, Kenneth Wink, James Wink and James Baldwin

Sources
If you found this article helpful, consider reading: